ZX Oncology / method review
Technical review of imaging methods: I compared definitions, thresholds and cross-cohort behaviour, and built tools to explore biomarker stability and errors.
Methodological contribution and reference reproduction.
Engineering · product · research
Full-Stack & Machine Learning Engineer
I build full-stack software and machine learning systems. At Farmium, I work across interfaces, backend services and integrations; my machine learning work covers signals and images, from data preparation to evaluation.
Interfaces, services and integrations for a content platform spanning planning, media libraries, analytics and workflows.
Farmium · ProductData preparation, features, classification and inference; tools to inspect and compare results.
Signals & visionReproducibility, cross-cohort behaviour and threshold analysis: turning assumptions into specific checks.
ZX OncologyEach case connects a problem, my contribution and concrete evidence: original product software, public data or an evaluation tool.
Radio signals & drones
Choose a recording and compare its reference with the archived prediction.
Waveformnormalized amplitude
Spectrogramnormalized frequency / time
Archived mean votes
Loading archived example…
Choose a recording and compare its reference label with the ensemble output.
DroneRF, Al-Sa’d and colleagues (2019). Signals were normalized for display; the spectrogram shows relative energy per fragment. Evaluation is offline and votes are not calibrated probabilities. Dataset and authors · CC BY 4.0.
The exploratory refit uses 211 development and 103 evaluation windows, with 51 correct predictions among those 103. The displayed selection illustrates all four classes; it does not summarize overall performance or establish field validation.
Computer vision
Choose a crop to compare its reference, score and decision.
 24 × 40 · original crop enlarged
InfraredSolarModules / 0
Dataset reference: Offline-Module
Choose an example and compare its reference with the archived decision.
Compare the false alarm with the missed case. The scores fall on opposite sides of the same threshold.
InfraredSolarModules — Raptor Maps (2020), MIT. Public 24×40 crops. The model shown prioritises anomaly/no-anomaly; archived scores are neither temperatures nor calibrated probabilities. Public source · MIT.
Product & systems
Drag the nodes and traverse the dependencies of this local workflow.
The DAG on this page is a local model: drag nodes and traverse their dependency order. The full product demo is linked below.
Explore the full product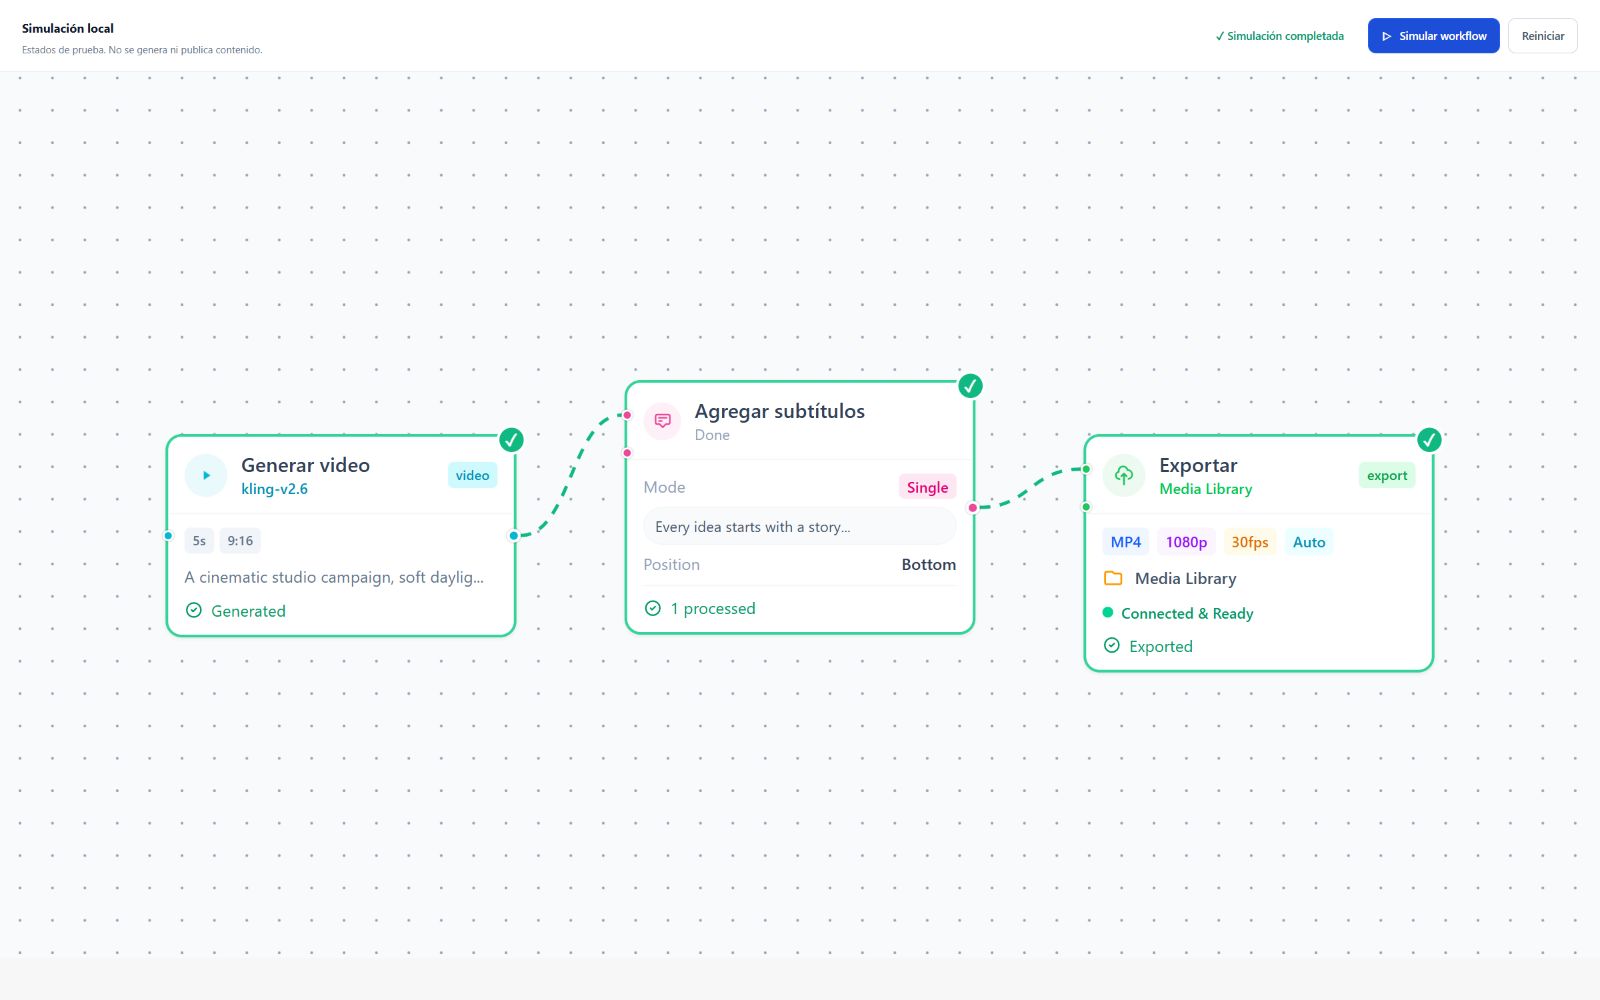
{
  "type": "media.process",
  "input": "asset_demo",
  "callback": "webhook_demo"
}
Illustrative contract for exploring an input, its status and an output event.
Technical contributions to review, reproduction and evaluation, focused on conclusions the evidence can support.
Technical review of imaging methods: I compared definitions, thresholds and cross-cohort behaviour, and built tools to explore biomarker stability and errors.
Methodological contribution and reference reproduction.
Import and validation, group-level aggregation and simple baselines. Units, timing and missing data are part of the contract before results are compared.
Data checks and reproducible comparisons.
I build evaluators to compare alerts by zone, type and interval, inspect idempotent duplicates, measure delivery delays and record missed events.
Independent prototype using synthetic events.
Local-computation prototypes for exploring estimation, image comparison, search strategies and relationships between ideas.
Lab · perception and tracking
A target moves while each sensor contributes a measurement with a different noise level. The Kalman filter combines those signals and updates its position and velocity estimate.
This model uses synthetic sensors and local computation. Explore what changes as measurements are added, removed or steered.
Toggle S1–S4, move your pointer over the field, or switch AUTO/MANUAL to steer the target.
Lab · image processing
This lab explores how a perturbation changes a synthetic image and what different comparison measures capture.
It computes an SSIM measure and L∞ and L2 distances as epsilon changes or the divider moves. Processing runs in the browser.
Move the divider and adjust epsilon. The metrics describe the difference between these two images.
Synthetic imagery and image-comparison calculations in the browser.
Lab · numerical optimisation
A lab for observing how different strategies search for minima on the same function. It exposes candidates, the best value and each method’s progress.
Choose a method, change its starting point and compare the path. The guide explains each element in the field.
Lab · graphs and reasoning
In applied research, I also contributed technical reviews, method reproduction and evaluation criteria.
This graph organizes families of critique and their connections: a way to explore structure, relationships and the questions worth making explicit.
Drag a node, inspect its label or perturb the network to see the layout reorganize.
Product · software · machine learning
To discuss a software or machine learning role, product development or a technical project.
Jeronimo Muñoz Larreta
Full-Stack & Machine Learning Engineer
Full-stack development and applied machine learning. Experience in product software, backend services, APIs, and signal and image processing, connecting data, evaluation and interfaces.
Co-founder · Full-stack development
Content-operation platform: accounts, media library, calendar, analytics and visual automation.
Independent projects
Methodological and evaluation contributions
TypeScript · Vue 3 · Node.js · NestJS · Prisma · Redis · APIs · WebSockets · Python · PyTorch · GPU · FFmpeg · Computer vision · RF signals · Experimental evaluation